What is Amazon QuickSight?
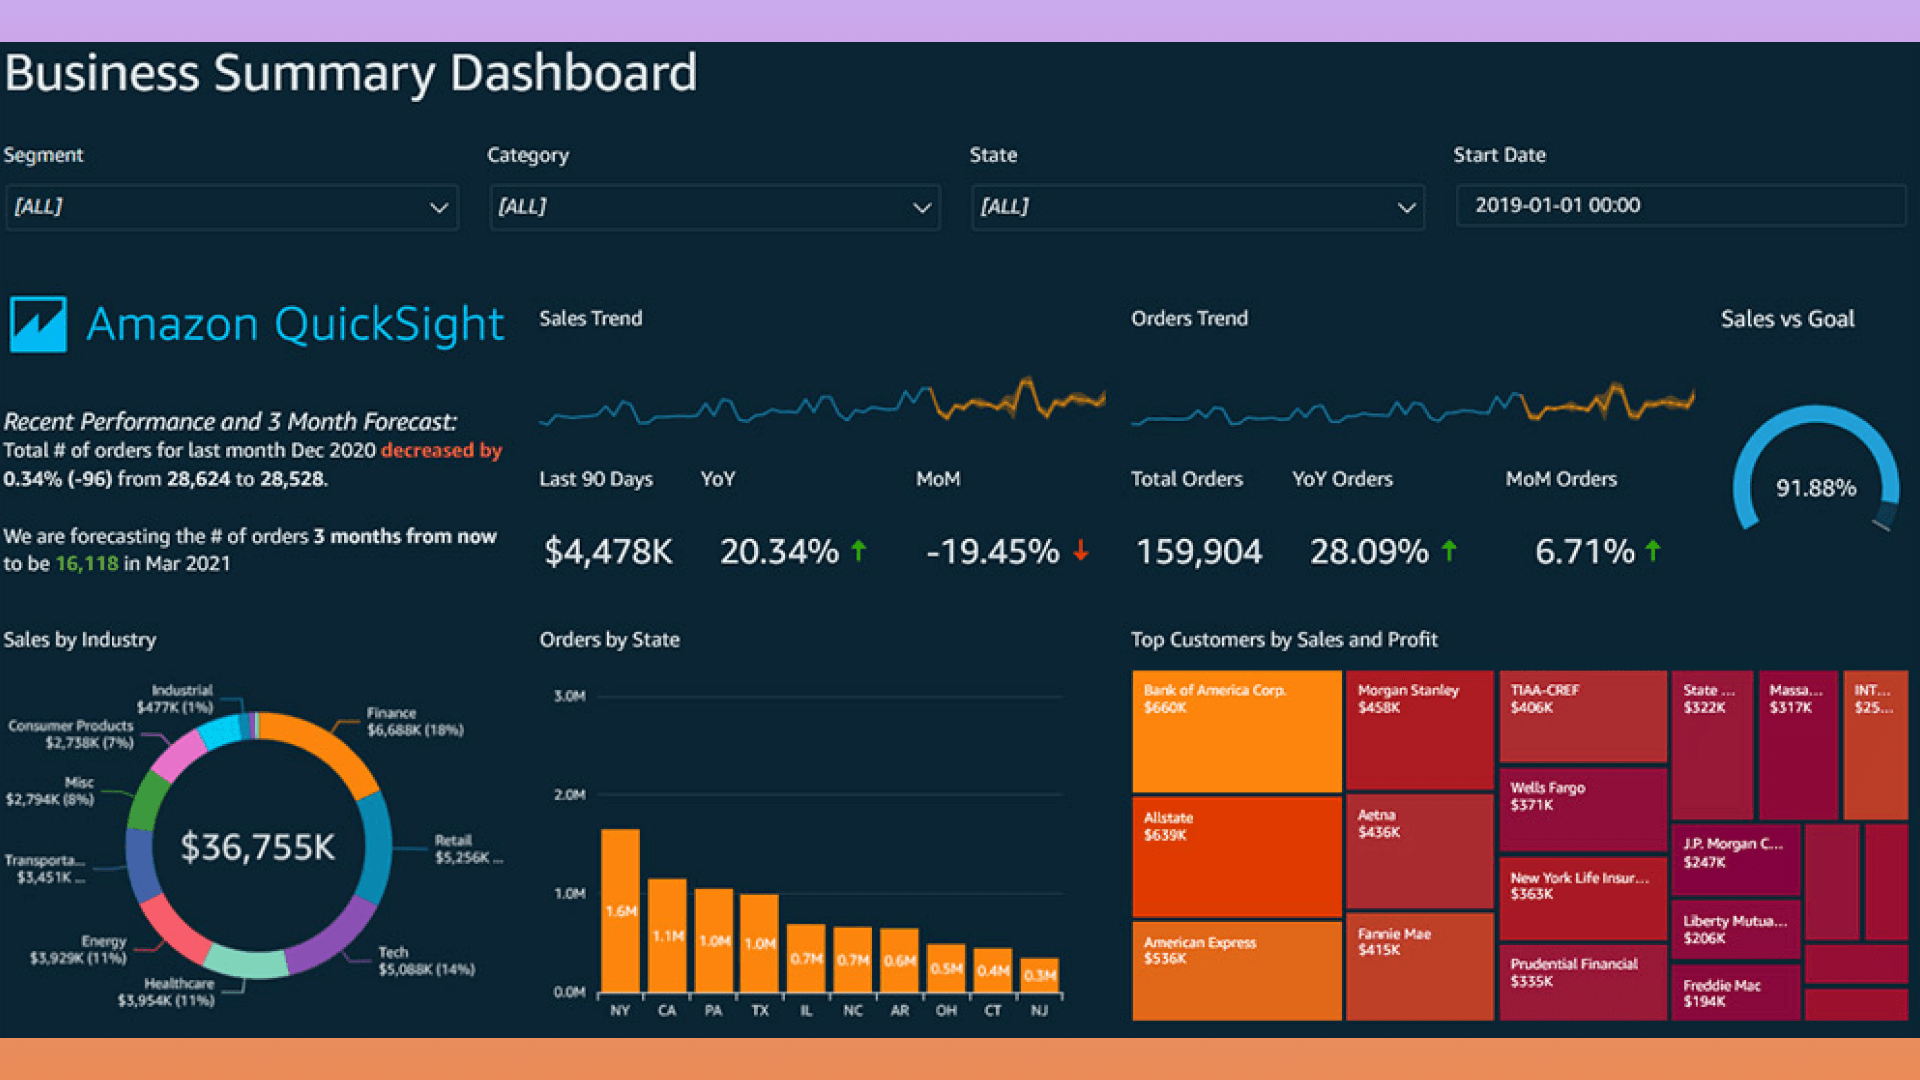
Source: AWS Blogs
Amazon QuickSight is a fully managed cloud-based BI service by AWS that provides interactive visualizations, advanced analytics, and data insights in a scalable and cost-effective manner. It is designed to help businesses of all sizes understand their data, create reports, and make data-driven decisions easily.
Key Features and Benefits
QuickSight offers several key features that distinguish it from other BI tools:
- Scalability: Can handle large volumes of data without compromising performance.
- Cost-Effective: Flexible, pay-per-session pricing, making it affordable for businesses of all sizes.
- Fast Performance: The SPICE (Super-fast Parallel In-memory Calculation Engine) accelerates data processing for quicker analysis.
- Machine Learning Insights: Automatically detects anomalies and trends in your data using built-in ML models.
- Integration with AWS: Seamlessly integrates with other AWS services like S3, Redshift, and RDS for easy data connectivity.
QuickSight Editions: Enterprise vs. Standard
Amazon QuickSight comes in two editions, each with unique capabilities:
| Feature | Standard Edition | Enterprise Edition |
| User Management | Basic | Advanced (IAM integration) |
| Data Capacity | 1 GB per user | More extensive capacity |
| Security | Basic | Advanced security (Row-Level, VPC) |
| Machine Learning | Limited | Full SageMaker integration |
- Standard Edition is ideal for small to medium-sized teams, whereas Enterprise Edition offers more advanced security and control features for larger organizations.
Use Cases and Industry Applications
Amazon QuickSight can be used in various industries, including:
- Finance: Track financial KPIs, forecasts, and budgets.
- Marketing: Analyze customer data and measure campaign effectiveness.
- Healthcare: Visualize patient outcomes, medical data, and operational metrics.
- Retail: Understand sales patterns, inventory, and customer preferences.
Getting Started with QuickSight
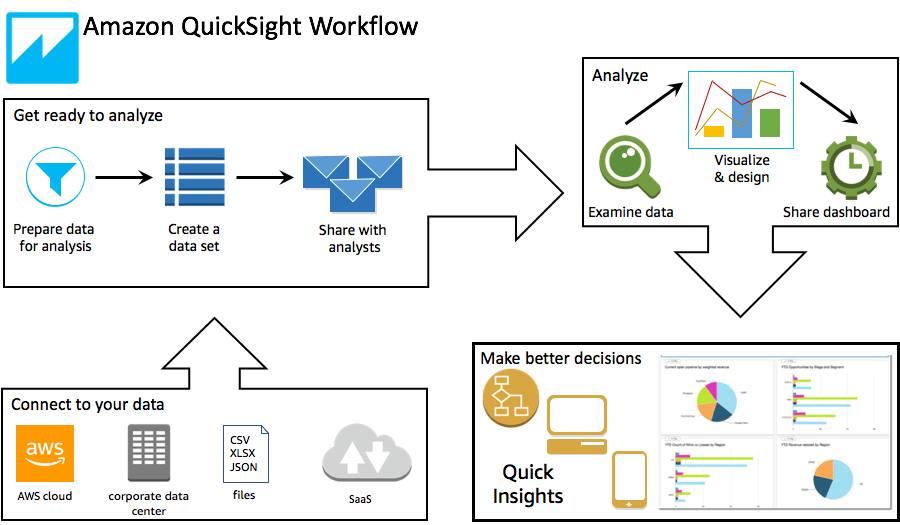
Source : AWS Docs
Setting Up Your QuickSight Account
To start with QuickSight, log into your AWS account, select QuickSight from the AWS console, and choose your preferred edition (Standard or Enterprise). Set up your account by adding users and defining your access permissions.
Exploring the QuickSight Interface
Once logged in, you’ll be greeted by a simple and intuitive interface. Key components include:
- Datasets: Connect your data sources (AWS or third-party) for analysis.
- Analysis: Create visualizations and insights from your data.
- SPICE Engine: Process data efficiently for fast querying and analysis.
- Dashboards: Share interactive reports and data visuals with your team.
Here’s a look at QuickSight’s main components:
User Management and Access Control
QuickSight allows you to manage user roles and permissions:
- Admins: Full access and control over the QuickSight environment.
- Authors: Can create and edit analyses, dashboards, and reports.
- Readers: View and interact with shared dashboards.
Access can be customized based on roles and needs, ensuring secure collaboration.
Connecting and Preparing Your Data
Supported Data Sources
Amazon QuickSight supports a wide range of data sources, including:
- AWS Services: Easily connect to services like S3, Redshift, and RDS.
- Third-Party Databases: Connect to databases such as MySQL, PostgreSQL, and SQL Server.
- File-Based Sources: Upload CSV, Excel, or other flat files for analysis.
Data Preparation and ETL
Before you analyze your data, QuickSight allows you to prepare and transform it using its ETL capabilities. You can clean, filter, and shape the data to fit your analysis needs. QuickSight offers two primary methods for accessing and preparing data:
| Method | SPICE | Direct Query |
| Speed | Faster, with data stored in-memory | Real-time, but may have slower performance |
| Data Handling | Works with large, static datasets | Works with real-time, dynamic data |
| Cost | Cost-effective, as data is cached in SPICE | Higher cost due to frequent live queries |
- SPICE: A high-performance engine for processing large volumes of data efficiently.
- Direct Query: Allows real-time data access but may not offer the same speed as SPICE.
SPICE vs. Direct Query
- SPICE: Best for working with large datasets that do not require real-time updates.
- Direct Query: Perfect for real-time access to live data when up-to-the-minute information is essential.
Data Modeling and Analysis in QuickSight
Creating Datasets and Data Preparation Rules
Before you can start visualizing data, you need to create datasets in QuickSight. A dataset is essentially a collection of data pulled from your data sources (e.g., AWS S3, Redshift, or other third-party databases). QuickSight allows you to define data preparation rules like filters and transformations to ensure your data is ready for analysis.
Creating a Basic Dataset Example:
Here’s how to create a simple dataset using QuickSight:
| bash 1. Select "New Dataset" from the QuickSight dashboard. 2. Choose your data source (e.g., S3, RDS). 3. Define filters and rules (e.g., filter by region or sales date). 4. Save and publish the dataset. |
Building Calculated Fields and Parameters
Calculated fields allow you to perform custom calculations on your data. For instance, if you want to calculate the total sales from price and quantity, you would create a field like this:
| sql Total_Sales = Price * Quantity |
Additionally, parameters help you create interactive dashboards. Parameters allow users to change values dynamically (e.g., selecting a date range for analysis).
Row-Level Security
Row-Level Security (RLS) enables you to control who can see which data in a dataset. For example, sales managers in different regions may only have access to data for their region. By applying RLS, QuickSight ensures that each user sees data that’s relevant to them.
Visualizations in Amazon QuickSight
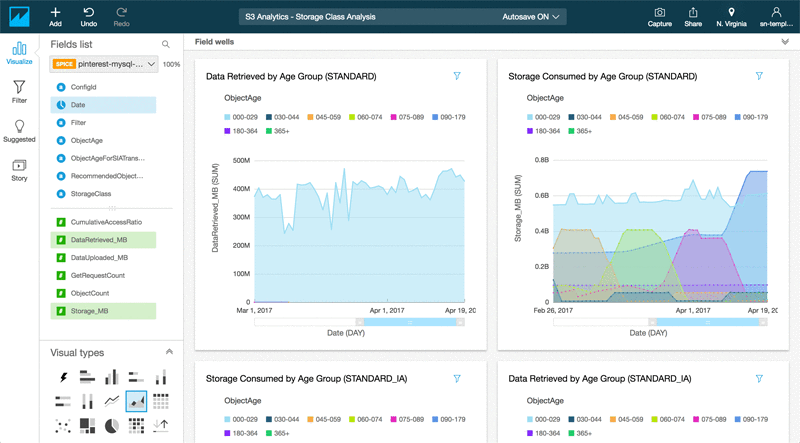
Source: AWS Blogs
Available Chart Types and Custom Visualizations
QuickSight supports a variety of chart types, from basic bar and line charts to more complex heat maps and scatter plots. Custom visualizations can also be created using JavaScript and the QuickSight SDK for more specialized use cases.
| Chart Type | Use Case |
| Bar Chart | Comparing categories (e.g., sales by region) |
| Line Chart | Analyzing trends over time (e.g., monthly sales) |
| Heat Map | Visualizing density or frequency of events |
| Pie Chart | Showing proportional data (e.g., market share) |
Using ML Insights in Visualizations
QuickSight integrates with AWS Machine Learning (ML) Insights to provide automatic anomaly detection, trend analysis, and forecasting directly in visualizations. These insights help you identify unexpected changes in your data or predict future trends, all without needing a data scientist.
Example of an ML Insight (Anomaly Detection) visualization:
| plaintext Data points that are significantly different from expected trends will be highlighted automatically in your dashboard. |
Incorporating Amazon Q into Visualizations
With Amazon QuickSight Q, users can now interact with their visualizations using natural language queries. This innovative feature allows you to ask questions directly from your dashboards without needing to write SQL queries or understand the underlying data structure.
For example, if you are analyzing sales data, you could ask, “What were the top-performing products last quarter?” Amazon Q would instantly respond with a visual representation of the data, making it easier for non-technical users to explore and understand the insights.
Benefits of Amazon Q in Visualizations:
- Accessibility: Non-technical users can quickly get insights using natural language.
- Dynamic Interactivity: Users can ask follow-up questions and refine their analysis in real-time.
- Immediate Insights: Instantaneously get answers to questions that would typically require complex queries or manual exploration.
Formatting, Styling, and Best Practices for Visualization Creation
Great visualizations tell a compelling story with your data. QuickSight provides a variety of formatting and styling options to enhance your visualizations:
- Keep visuals simple: Focus on key insights rather than overloading the user with too many details.
- Use contrasting colors: Highlight important trends or data points using easily distinguishable color schemes.
- Label axes and data points: Ensure that your audience can quickly understand what the chart represents.
- Optimize for mobile: If your users access the dashboards on mobile devices, ensure that the visuals are responsive and easy to interpret.
Performance Optimization for Visualizations
As your datasets grow, the performance of your visualizations may slow down. To ensure that your dashboards load quickly and efficiently:
- Use SPICE: Leverage SPICE (Super-fast Parallel In-memory Calculation Engine) to accelerate data processing and improve visualization performance.
- Limit the number of charts: Reducing the number of charts on a single dashboard can help with load times and enhance clarity.
- Apply filters: Use filters to limit the amount of data being displayed at any given time, ensuring that only relevant data is visualized and improving performance.
Advanced Analytics in QuickSight
Anomaly Detection and Natural Language Querying (Q&A)
QuickSight’s Anomaly Detection automatically detects outliers in your data and highlights unusual patterns, helping you make data-driven decisions faster.
Natural Language Querying (Q&A) enables users to ask questions in plain English (e.g., "What is the total revenue this year?"). QuickSight will translate the question into a query and return the answer in the form of visualizations.
Example Q&A:
| plaintext "What is the average revenue for Q1?" |
SageMaker Integration and its Role in Advanced Analytics
QuickSight integrates with Amazon SageMaker to enhance its machine learning capabilities. With SageMaker, you can train and deploy custom ML models and apply them directly to your QuickSight visualizations. This integration helps create more accurate predictions, recommendations, and deeper insights.
Example:
| bash 1. Train a model in SageMaker. 2. Integrate the model with QuickSight. 3. Use it for predictions in your dashboards. |
Anomaly Detection and Natural Language Querying (Q&A)
One of the standout features in Amazon QuickSight is Amazon QuickSight Q, which enables users to interact with their data using natural language. Instead of writing complex queries, users can simply ask questions in plain English, and QuickSight will generate insightful responses in the form of visualizations.
For example, you can ask, "What were the sales in New York last quarter?" and QuickSight Q will provide an interactive chart displaying the requested data. This makes advanced analytics accessible to all users, regardless of their technical skill level.
How Amazon Q Works:
- Natural Language Processing: Amazon Q uses advanced NLP models to interpret your questions.
- Interactive Dashboards: Q integrates seamlessly with your QuickSight dashboards, providing dynamic responses based on your inquiry.
- Data Discovery: Even if you're unsure of the exact metrics you're looking for, Amazon Q helps you explore your data more intuitively.
Building and Managing Dashboards
Dashboard Layout and Design Principles
The layout and design of your dashboards are crucial for clarity and user experience. When creating dashboards in QuickSight:
- Organize components logically (e.g., place KPIs at the top).
- Use clear titles and labels.
- Ensure that filters are easily accessible.
Interactive Features: Filters, Actions, and User Interactivity
QuickSight allows users to interact with dashboards by applying filters or using actions. For example, you could create a filter for "region" so that users can view data relevant only to their chosen region.
Action Example:
You could add an action to a chart so that clicking on a specific data point navigates to a more detailed report.
Sharing, Collaboration, and Version Control for Dashboards
Once you’ve built a dashboard, QuickSight allows you to share it with others. You can provide access to specific users or groups, ensuring that everyone has the right level of access. Version control helps track changes made to dashboards, enabling collaboration without confusion.
Embedded Analytics in QuickSight
Overview of QuickSight SDK and Embedding Options
QuickSight provides an SDK that enables you to embed its visualizations into your web or mobile applications. This is perfect for businesses looking to provide analytics directly within their products or customer-facing platforms.
Example of embedding:
| javascript const quickSight = new AWS.QuickSight({ region: 'us-east-1' }); quickSight.embedDashboard({ DashboardId: 'abc123', Container: document.getElementById('dashboardContainer') }); |
Authentication and Authorization for Embedded Analytics
Embedded analytics in QuickSight supports IAM authentication, ensuring that only authorized users can access the dashboards. You can define roles and permissions for users accessing the embedded analytics, providing a secure way to manage data access.
Customization Capabilities and Pricing Considerations
Customizing embedded dashboards allows businesses to seamlessly integrate QuickSight into their own UI/UX. The pricing for embedded analytics is based on usage, with options to control costs by adjusting the number of active sessions and features.
Security, Governance, and Compliance
IAM Integration and User Permissions
Identity and Access Management (IAM) plays a key role in securing your QuickSight environment. With IAM, you can manage who can access QuickSight and what they can do within the service. For example, you might assign the following roles:
| IAM Role | Description |
| Admin | Full access to QuickSight features |
| Reader | Read-only access to dashboards |
| Author | Create and manage dashboards, but no admin access |
Row-Level Security Implementation
Row-Level Security (RLS) helps ensure that users only see data relevant to them. You can configure RLS policies based on user attributes, such as region or department, ensuring data confidentiality.
RLS Example:
| sql IF UserRegion = 'US' THEN show US data IF UserRegion = 'EU' THEN show EU data |
VPC Connectivity and Encryption Options
QuickSight supports VPC connectivity for secure access to your data sources without going through the public internet. Encryption of data both at rest and in transit is fully supported by default.
Example Encryption in Transit: QuickSight uses SSL encryption (TLS) to secure data while it’s being transferred.
Compliance with Industry Standards and Regulations
QuickSight complies with various industry standards such as GDPR, HIPAA, and SOC 2, making it suitable for businesses operating in regulated industries.
Optimizing Performance in QuickSight
SPICE Optimization Techniques and Query Performance
To improve performance, QuickSight uses SPICE (Super-fast, Parallel, In-memory Calculation Engine), which speeds up data processing. Optimizing SPICE is key for handling large datasets.
Optimization Tips for SPICE:
- Use filtering to limit the data loaded into SPICE.
- Reduce joins in datasets where possible.
- Regularly refresh datasets to ensure up-to-date data.
Best Practices for Large Datasets and Dashboard Loading Times
When working with large datasets, it’s important to optimize both the dataset and the dashboards for fast loading.
| Optimization Tip | Benefit |
| Use SPICE | Faster data processing and reduced query times |
| Limit data in dashboards | Reduces unnecessary load and speeds up the dashboard |
| Optimize visualizations | Decreases the number of data points rendered at once |
Administration and Maintenance
Managing QuickSight Subscriptions and Usage
QuickSight offers flexible subscriptions based on user needs. You can manage users and their permissions through the AWS Management Console, and optimize costs by reviewing your subscription types.
Subscription Management Example:
| bash 1. Go to the QuickSight console. 2. Select "Manage Users" to modify subscriptions. 3. Change from Reader to Author if necessary. |
Monitoring Usage and Capacity Planning
Usage monitoring helps ensure that you’re not exceeding the limits of your QuickSight subscription. Keep an eye on usage via AWS CloudWatch to ensure smooth operations.
Capacity Planning Example:
- Monitor dashboard access patterns.
- Adjust SPICE capacity or add more users as demand grows.
Backup, Recovery, and Cost Optimization Best Practices
To maintain uptime and optimize costs:
- Backup: Regularly export critical data for redundancy.
- Recovery: In case of failure, ensure you have a rollback plan.
- Cost Optimization: Review usage periodically to eliminate unused datasets.
Integration with the AWS Ecosystem
Integrating with AWS Services (CloudWatch, CloudTrail, etc.)
QuickSight integrates seamlessly with AWS services like CloudWatch for monitoring and CloudTrail for logging API calls. These integrations enhance your ability to manage QuickSight and troubleshoot issues.
Example: Using CloudWatch for Monitoring:
| bash aws cloudwatch get-metric-statistics --namespace "AWS/QuickSight" --metric-name "DashboardLoadTime" --period 3600 |
Cross-Region Deployment and Scaling
QuickSight allows you to deploy across multiple AWS regions, ensuring your dashboards and data remain accessible globally. This feature is useful when scaling for larger organizations with a global presence.
Using CloudWatch for Monitoring and CloudTrail for Logging
- CloudWatch helps you monitor the performance of your dashboards.
- CloudTrail logs all user activity for auditing purposes.
Troubleshooting and Common Issues
Identifying and Resolving Common Error Messages
Here are some common error messages you might encounter in QuickSight:
| Error Message | Possible Cause | Resolution |
| "Data source connection failed" | Incorrect connection credentials | Check credentials and permissions |
| "Dataset failed to refresh" | Query timeout or large dataset size | Optimize your SPICE dataset or use Direct Query |
| "Permission Denied" | Lack of sufficient IAM permissions | Update IAM roles and permissions |
Performance and Connectivity Issues: Best Practices for Resolution
To troubleshoot performance and connectivity issues:
- Check CloudWatch logs for resource bottlenecks.
- Use AWS VPC connectivity for secure and faster access to data sources.
Best Practice Example for Performance:
| bash 1. Use SPICE for in-memory calculations. 2. Apply filters to reduce the dataset size. 3. Ensure users have the right IAM permissions to avoid access issues. |
Future Roadmap and Updates
Recent Features and Updates in Amazon QuickSight
Amazon QuickSight continues to evolve, with frequent feature updates aimed at enhancing both usability and functionality. For example, ML-powered insights were recently introduced, allowing users to uncover patterns in their data without needing deep data science expertise.
Recent Updates:
- ML Insights: Added machine learning-powered anomaly detection.
- Multi-Region Deployment: Now available for better global scaling.
- Embedded Analytics Enhancements: Improved embedding options for seamless integration into external apps.
Upcoming Capabilities and Industry Trends
QuickSight’s roadmap includes several exciting upcoming features, such as AI-powered predictive analytics and advanced dashboard customization. The growing trend toward integrating artificial intelligence (AI) and machine learning (ML) into business intelligence tools is expected to push QuickSight further ahead in the analytics space.
Upcoming Features:
- Predictive forecasting models based on historical data.
- More intuitive dashboard customization options.
- Integration with AWS SageMaker for advanced AI modeling.

