
1. The Observability Bill You Did Not Plan For
On May 21, 2026, the Cloud Native Computing Foundation (CNCF) announced that OpenTelemetry had reached its highest maturity level, known as Graduated status. This puts the project in the same category as Kubernetes and Prometheus. For teams that were still unsure whether OpenTelemetry was ready for production use, this milestone settles the question. It is no longer an experimental tool to plan for later. It is a stable, widely adopted standard used across thousands of companies today.
This milestone also arrives at a time when many engineering teams are struggling with rising observability costs. Monitoring bills are increasingly growing faster than the infrastructure they are meant to track.
A large part of this problem comes from how most observability vendors calculate their pricing. Bills are typically based on three factors: how much data is sent in (ingest volume), how many unique combinations of metric labels exist (cardinality), and how many hosts or nodes are being monitored.
In a Kubernetes environment, all three of these factors increase naturally as workloads scale. When Horizontal Pod Autoscaling or cluster autoscaling adds new pods and nodes to handle traffic, monitoring costs scale up right along with them, often faster than expected. Many teams that sized their monitoring contracts around a fixed, stable cluster later find their observability bill catching up to, or even passing, their actual cloud compute spend.
2. What OpenTelemetry Is, and What It Is Not
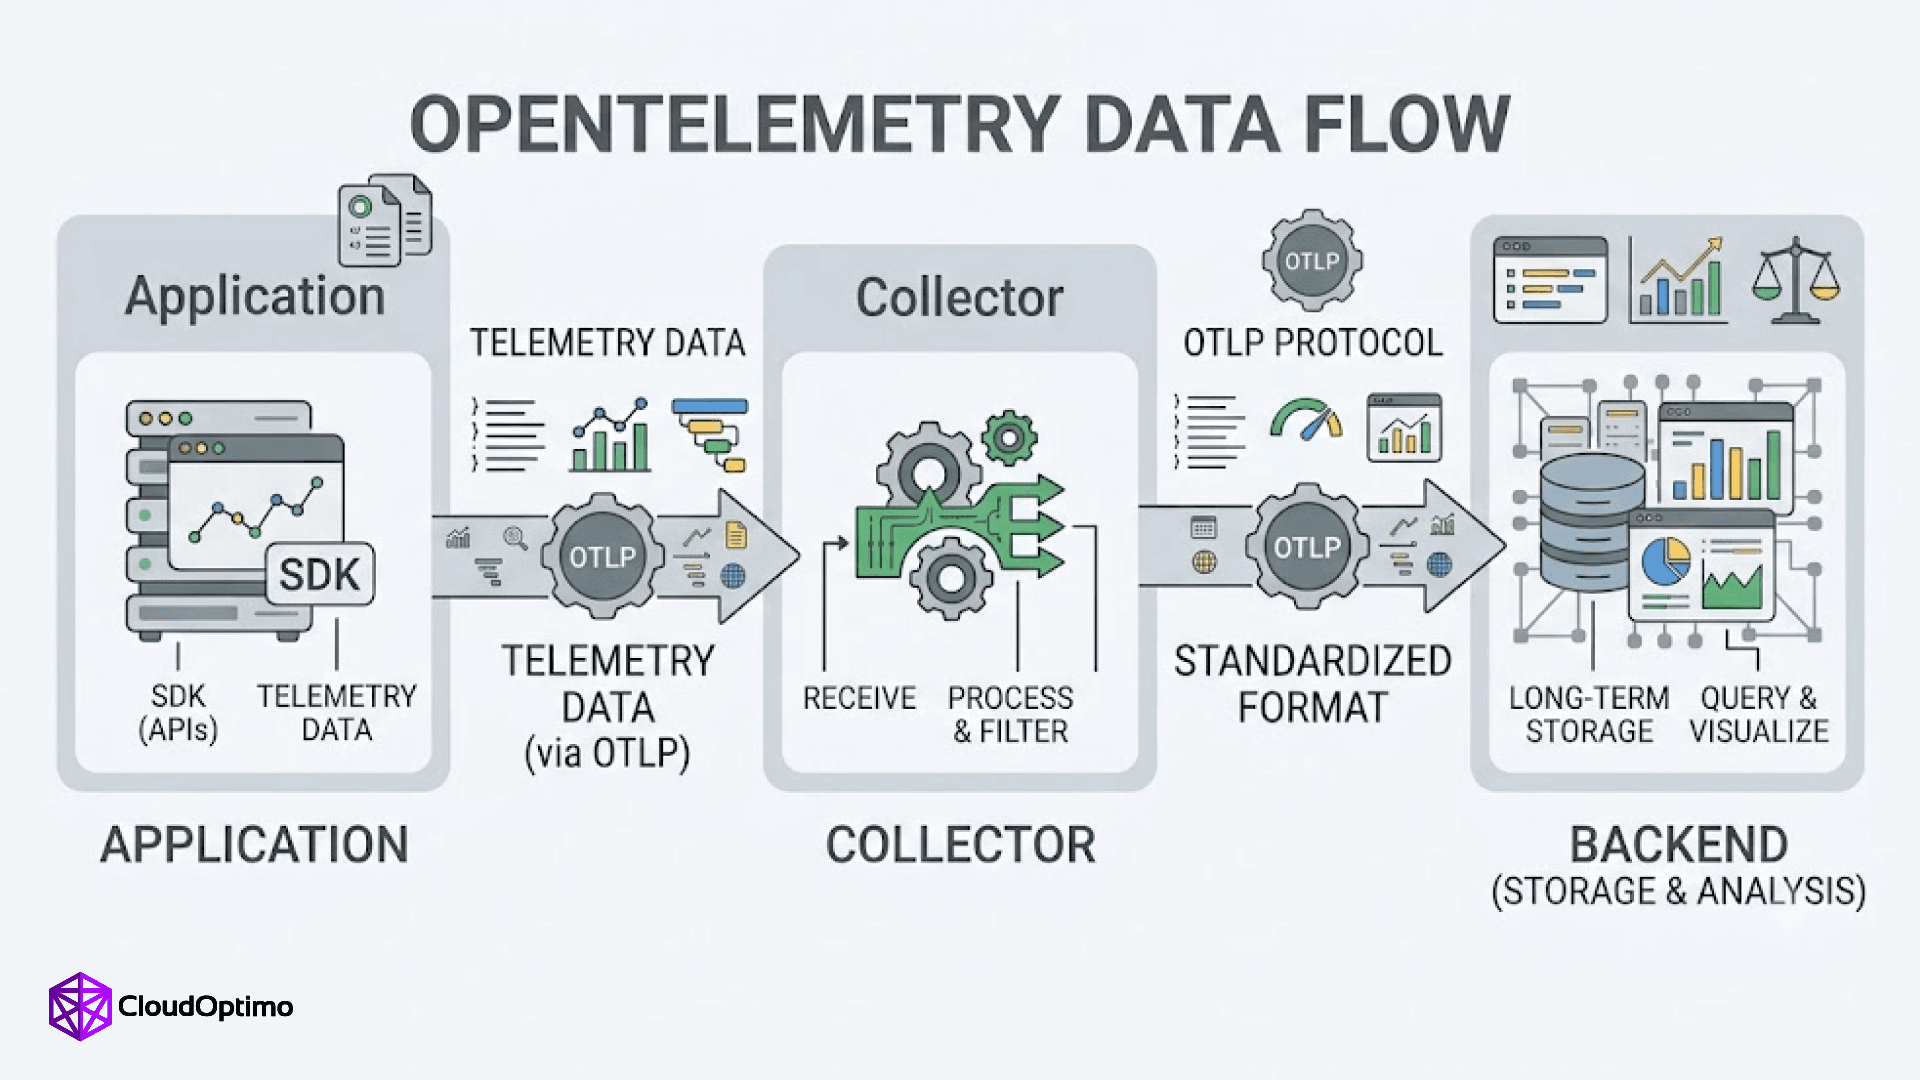
Fig 1: OpenTelemetry moves data through three stages: application SDKs generate it, the Collector processes it, and OTLP carries it in a standard format to any backend. This separation is what lets teams control cost and switch backends without touching application code.
Before looking at how to control these costs, it helps to be clear about what OpenTelemetry actually does.
OpenTelemetry is made up of three main parts. The first is a set of APIs and SDKs that applications use to generate telemetry data, such as traces, metrics, and logs, in each supported programming language. The second is the OpenTelemetry Collector, which receives, processes, and forwards this data. The third is OTLP, the OpenTelemetry Protocol, which defines a standard format for sending this data between systems.
What OpenTelemetry does not include is just as important to understand. It does not store data long term. It does not come with a query language. It does not provide dashboards. Teams still need a separate backend, whether a commercial vendor or a self-hosted platform, to actually store and analyze the data that OpenTelemetry collects.
This separation is exactly where the value lies. Before OpenTelemetry became the standard, a typical Kubernetes node would often run several separate agents at once: one for metrics, such as Prometheus Node Exporter, one for logs, such as Fluentd or Fluent Bit, and one for traces, often a vendor-specific agent. Each of these agents used its own format, consumed its own share of node resources, and had to be managed separately.
OpenTelemetry replaces this setup with a single collection layer. Because instrumentation is decoupled from the backend, teams can filter, process, or reduce telemetry data before it ever reaches a vendor, and they can switch backends without having to rewrite application code or redeploy new agents across every node.
3. The Two-Tier Collector Architecture
The OpenTelemetry Collector is flexible enough to run as a single instance, but most production Kubernetes deployments use a two-tier setup instead. This design separates the work of collecting data locally from the work of processing it centrally, and each tier is built to do one job well.
The Agent tier runs as a Kubernetes DaemonSet, meaning one Collector pod runs on every node in the cluster. Its job is to gather data that is only available locally. It uses the kubeletstats receiver to read CPU and memory data directly from the node's kubelet, and the filelog receiver to read application logs written to the node's filesystem. Because it runs directly on the node, it avoids unnecessary network calls and keeps this local traffic fast and cheap. At this stage, the k8sattributes processor also adds useful Kubernetes metadata to the data, such as the pod name, namespace, and deployment name, before passing it along.
The Gateway tier runs as a standard Kubernetes Deployment, usually with several replicas behind a load balancer. This tier receives the already-enriched data from every Agent across the cluster and performs the heavier processing work: batching data efficiently, applying transformation rules, and running tail-based sampling, which requires seeing an entire trace across multiple pods and nodes before deciding whether to keep it.
This two-tier design is not just a matter of preference. A single trace can span several pods running on different nodes, so only a centralized Gateway has the full picture needed to make accurate sampling decisions. At the same time, only a node-local Agent can efficiently read local log files and query the kubelet without requiring broad, less secure permissions across the cluster. Combining both roles into one tier means giving up one of these two capabilities.
Rather than managing this setup manually with Helm charts or raw YAML files, most teams use the OpenTelemetry Operator, which allows the Agent and Gateway tiers to be defined declaratively through custom resources. One requirement worth noting: the Operator depends on cert-manager being installed in the cluster, since it uses cert-manager to handle the certificates needed for its webhooks.
4. Zero-Code Auto-Instrumentation
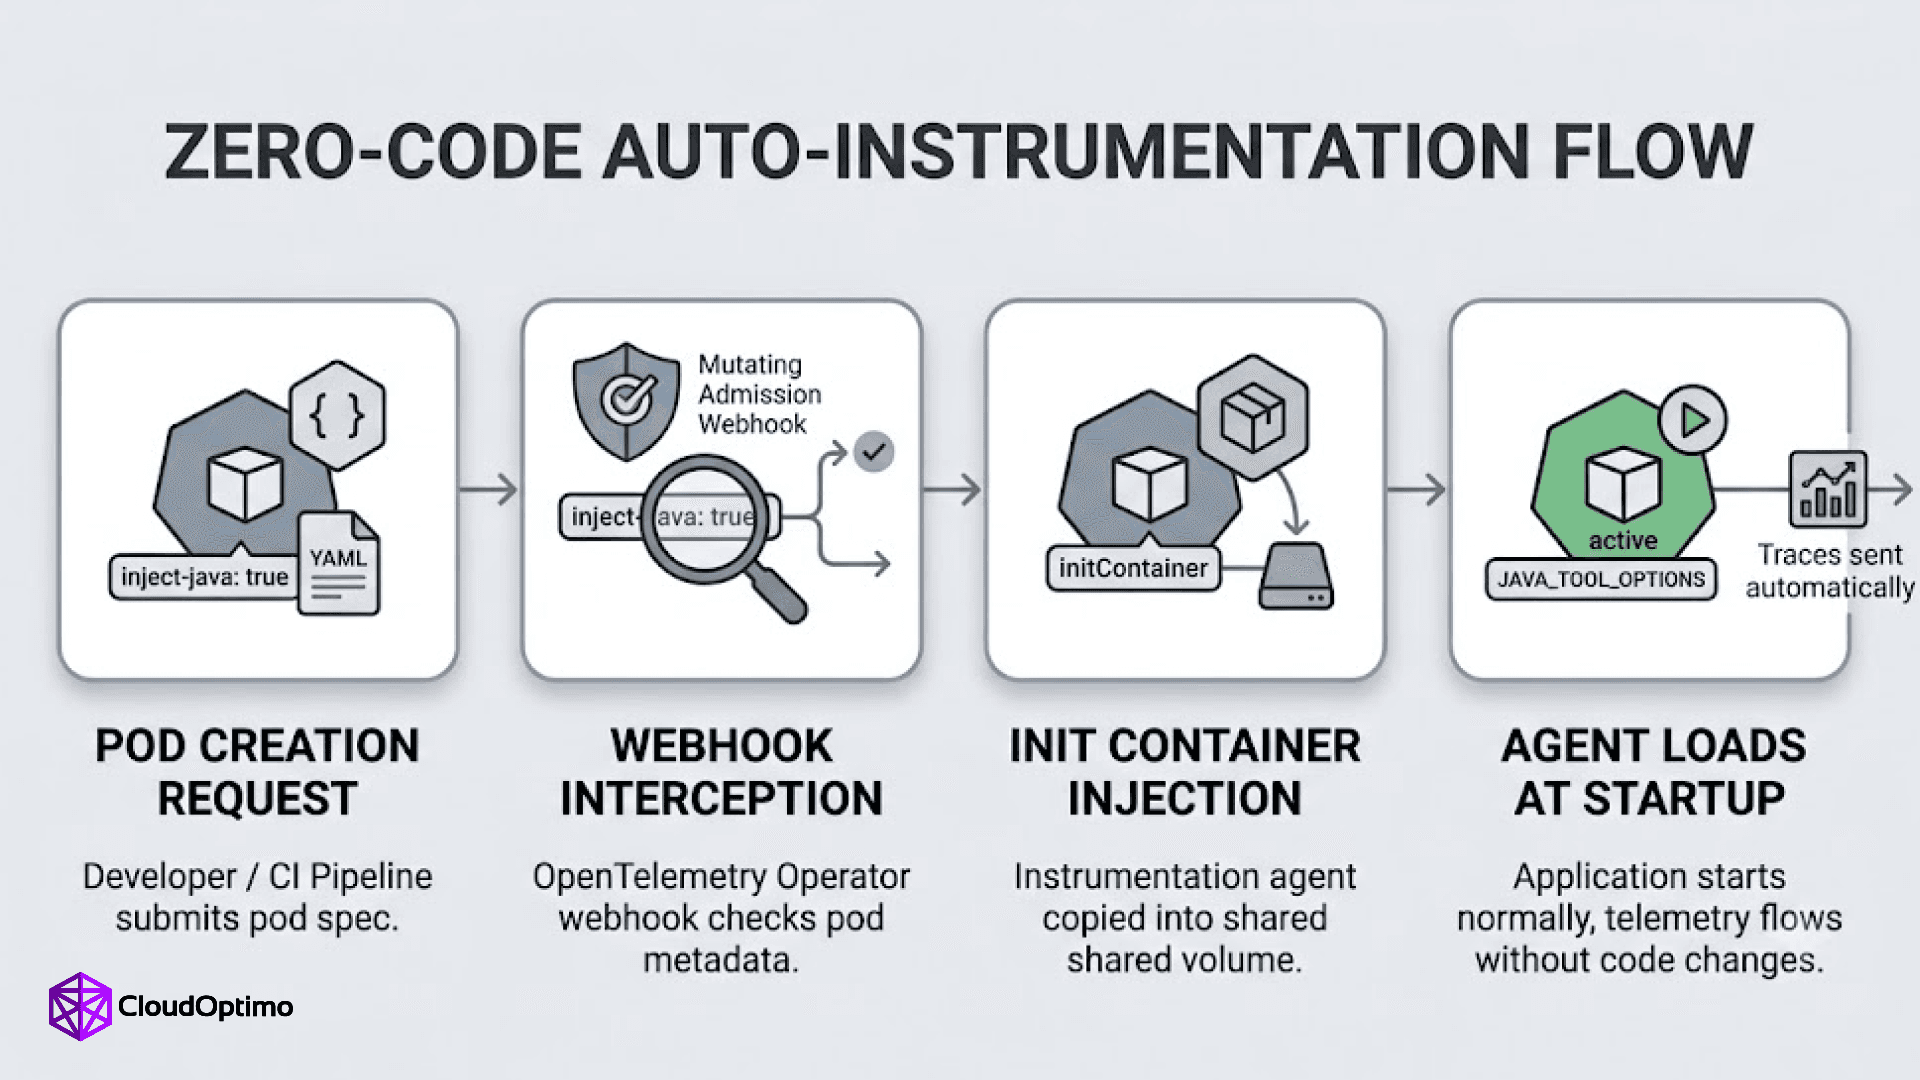
Fig 2 : When a pod is created, the OpenTelemetry Operator's webhook detects an instrumentation annotation and injects an agent before the application starts.The application boots normally and begins sending traces automatically, with no code changes required
Traditionally, adding tracing to an application meant developers had to manually add vendor SDKs and wrap functions with tracing code by hand. This slowed down rollout and often led to incomplete coverage across services. OpenTelemetry avoids this problem through auto-instrumentation, which requires no changes to application code at all.
This works through a Kubernetes mechanism called a mutating admission webhook, managed by the OpenTelemetry Operator. Whenever a new pod is created, the webhook checks its metadata for a specific annotation, such as one indicating the pod should be instrumented for Java, Python, or another supported language. If it finds one, it modifies the pod before it starts running. For most languages, this means adding an initContainer that copies the instrumentation agent into a shared volume, along with the environment variables needed to load it automatically when the application starts. The application runs as usual and begins sending trace data without any code changes on the developer's side.
A couple of language-specific details are worth knowing. For Python applications running on Alpine-based containers, which use the musl C library instead of the more common glibc, the standard instrumentation binaries will not work and can cause the application to crash. Platform teams need to add a separate annotation to tell the Operator to inject the correct musl-compatible binaries instead. Go presents a different challenge, since Go applications are compiled directly into machine code, which makes the usual instrumentation approach impossible. To work around this, OpenTelemetry uses eBPF, a Linux kernel technology that can observe an application's behavior from outside the process itself, without modifying the compiled binary.
One risk with this webhook-based approach deserves attention. If the Operator is temporarily unavailable, for example during a restart, pod creation requests can bypass the webhook entirely. Depending on the configured failure policy, this can go unnoticed. With failurePolicy: Ignore, the pod is simply created without instrumentation, and it will run and serve traffic normally, but produce no telemetry data at all. This kind of gap can go undetected for a long time. Setting failurePolicy: Fail instead blocks pod creation if instrumentation cannot be applied, which is safer from an observability standpoint. However, this setting needs to explicitly exclude critical namespaces like kube-system. Without that exclusion, a temporary webhook issue could prevent core cluster components from starting at all.
5. The Two Cost Levers
Once telemetry is flowing through the pipeline, the next priority is reducing how much of it actually needs to be sent to a backend. Two mechanisms at the Gateway level make the biggest difference here.
The first is tail-based sampling. Many traditional tracing setups use head sampling, where the decision to keep or discard a trace is made right when the request starts, before anyone knows how it will turn out. This means a fixed percentage of traces are kept at random, which can easily discard the failed or slow requests that matter most for debugging. Tail-based sampling solves this by waiting until a trace is complete before deciding whether to keep it, since the Gateway can see the full picture across all the services involved.
This allows for more useful sampling rules, such as the ones below:
| Sampling Rule | What It Keeps |
| Status code | All traces that include an error |
| Latency | All traces that take longer than a set threshold, such as 2 seconds |
| Attribute | All traces from a specific endpoint or service marked as high priority |
| Probabilistic | A small random percentage of all remaining, healthy traces |
The tradeoff is that tail-based sampling needs to hold traces in memory until they are complete, which can use a meaningful amount of RAM on the Gateway, especially under heavy load. Teams need to size Gateway resources with this in mind and keep an eye on the otelcol_processor_refused_spans metric, which signals that the Gateway is dropping data because it is running short on memory.
The second lever is cardinality control, handled through OTTL, the OpenTelemetry Transformation Language. High cardinality happens when a metric label has too many unique values, such as a user ID or a session ID attached to every data point. Each unique combination becomes its own billable time series, and this can grow out of control quickly. OTTL statements can remove these fields before the data leaves the cluster:
| yaml processors: transform: metric_statements: - context: datapoint statements: - delete_key(attributes, "user_id") |
OTTL can also be used with functions like drop_bucket, which removes empty or low-value histogram buckets that otherwise add unnecessary size to the data being exported.
6. Where Observability Spend Hides on the Cloud Bill
Tail sampling and cardinality control reduce the size of the vendor's monthly invoice, but there is a second cost that is easy to miss. It sits inside the cloud provider's own bill, not the observability vendor's.
Telemetry data has to travel before it becomes useful. Every metric, log line, and trace sent to an external monitoring backend crosses the cloud provider's network boundary, and that crossing is billed.
Take a Kubernetes cluster running in a private subnet, which is standard practice for production workloads. Sending data out to the public internet typically costs around $0.09 per GB for standard egress on major cloud platforms. Since the cluster sits in a private subnet, that traffic also has to pass through a NAT gateway first, which adds a separate processing charge, often close to $0.045 per GB. Together, this adds up to roughly $0.135 for every GB of telemetry that leaves the cluster. If the Collector's Agent and Gateway tiers happen to run in different availability zones, there is often an additional cross-zone transfer charge as well, usually a few cents per GB in each direction.
To put this in perspective, consider a cluster generating around 15 TB of unsampled telemetry per month, with no sampling applied at the Gateway. NAT gateway processing alone could add up to roughly $675 for the month. Standard internet egress on that same volume could add close to $1,325 more, and cross-zone transfer between the Agent and Gateway tiers could add a few hundred dollars on top of that. Altogether, a cluster in this situation could be looking at somewhere around $2,000 to $2,300 in network transfer costs every month, separate from whatever the observability vendor charges for ingesting the data.
The reason this cost is so easy to miss is that it rarely shows up under a label anyone recognizes. On a cloud provider's billing report, these charges usually appear under generic line items like data transfer or NAT gateway usage, mixed in with every other source of network traffic in the account. Very few teams take the time to trace these charges back to their observability pipeline specifically, even though the pipeline is often a major contributor.
This is exactly why tail sampling has a financial impact beyond the vendor invoice. Dropping a large share of trace volume at the Gateway does not just reduce what the observability vendor charges. It also reduces the NAT gateway and internet egress charges tied to that same data, since less of it ever needs to leave the cluster in the first place.
7. What OpenTelemetry Does Not Fix
Adopting OpenTelemetry means taking on real operational responsibility. The Gateway tier becomes critical infrastructure. If it crashes or runs out of memory due to a poorly tuned sampling configuration, telemetry data across the entire cluster can be lost. Running this setup well requires tuning memory limits, scaling the Gateway to handle traffic spikes, and keeping an eye on the pipeline itself, much like monitoring any other production service.
OpenTelemetry also does not solve the problem of making sense of the data once it has been collected. Standardized, well-organized telemetry is a big improvement over fragmented tooling, but during an actual incident, someone still has to interpret what that data is showing. Features like automated root cause analysis, anomaly detection, and service dependency mapping come from the backend platform a team chooses, not from OpenTelemetry itself. It is worth mentioning that some teams also use pure eBPF based tools, such as Grafana Beyla, as an alternative way to collect telemetry directly from the kernel, without relying on the webhook and initContainer approach described earlier. This is a different technique from OpenTelemetry's own use of eBPF for Go, since these tools operate entirely outside of OpenTelemetry's instrumentation layer.
8. Conclusion
OpenTelemetry gives platform teams real control over their telemetry pipeline, from how data is collected to how much of it actually leaves the cluster. Combined with tail-based sampling and cardinality control, it turns observability from a cost that scales unpredictably into one that can be measured and managed. The tradeoff is that this control comes with added operational responsibility, and the data still needs a capable backend to become genuinely useful during an incident. For teams evaluating their monitoring spend, a good starting point is simply understanding where the current pipeline stands on both fronts, cost and coverage, before deciding what to change.

